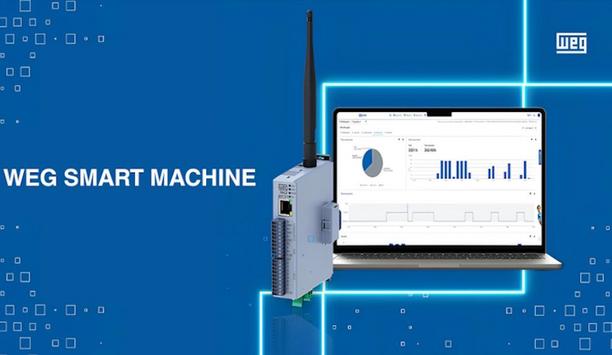
SYNERGY is a supervision and Energy Management web-based software that provides the monitoring and control of the electrical installation, from every computer or mobile device through the most popular web browsers in a simple and efficient way.
In addition to electrical quantities, it lets to check all environmental and process information (operating status, alarms, etc.), acquired from LOVATO Electric products or third-party devices, equipped with communication port and Modbus protocol, and thereby to carry out commands and parameterizing.
Custom web pages with widgets
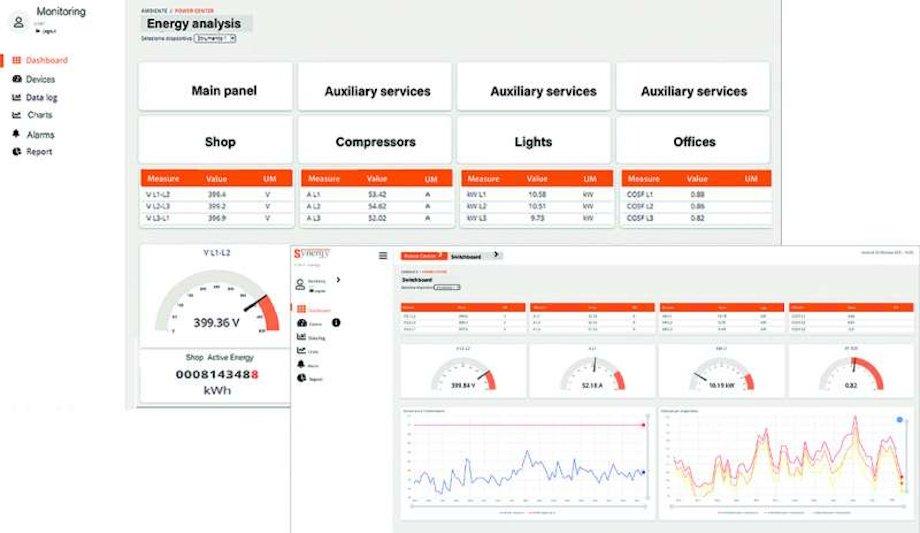
SYNERGY enables the user to create custom web pages with widgets featuring graphs
SYNERGY enables the user to create custom web pages with widgets featuring graphs, tables, gauges, and alarm conditions.
SYNERGY has been deeply renewed in its graphical interface and is available in the Cloud version or for installation on a local server (On-Premises) to offer users:
- a more modern approach from the point of view of aesthetics, by using “Bootstrap” and “material style” was used
- an improved user experience (software usability), making the operations to be performed more intuitive
- a responsive web interface, which therefore can be correctly displayed even on mobile devices such as smartphones. The result is that the user finds himself operating in a “familiar” environment, because it is similar to those ones he normally uses for other purposes (on banking, web mail, etc.).
SYNERGY: two new concepts
All known SYNERGY features remain available. However, two new concepts have been introduced:
- The DASHBOARD view displays: replaces the SYNERGY live page and may contain, in addition to the usual indicators (gauges, counters, panels, etc …), also graphs and tables based on data logs or reports; normally the user accesses a dashboard with his login and for most of the time he will remain there, finding all the information he needs, reducing the need to browse the site.
- Environment: it is a collection of dashboards, dedicated to a subset of devices under the control of SYNERGY. For example, the monitoring of a chain of stores, or of a series of company branches, can be organized in aggregations by site (each site is an environment), or by user (each user who accesses is an environment), by type of departments (all site warehouses can be an environment), and so on.
A flexible, user-friendly, open, and scalable energy monitoring system is ready for the challenges of the future.